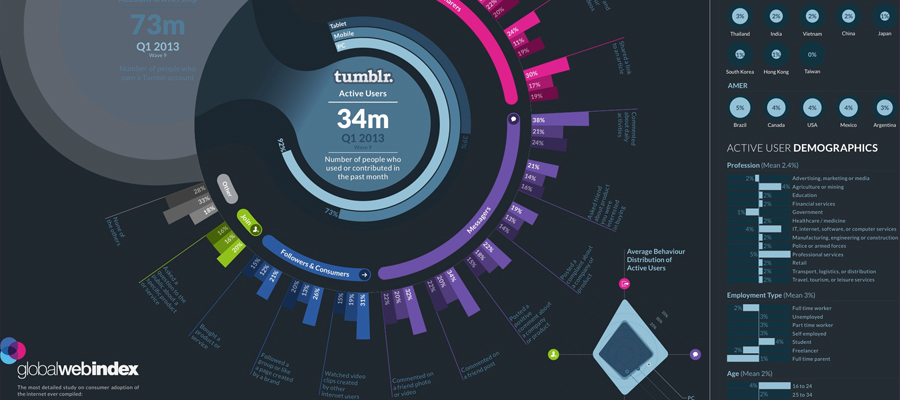
Is infographic dead? It’s a fair question to ask. With all the talk about charts, 3d design renders and maps it almost seems like infographic has peaked its prime. But, infographics are still as important or even more critical than they were before.
The proof? 65% of your audience are visual learners. And that’s not all. The human brain processes visuals 60,000 times faster than text. And finally, the demand for infographics has also gone up over the past few years.
But there’s more to infographics than the stats. There’s also creating the infographic and making sure it turns out impeccable.
In this blog post, you will learn the elements of a good infographic and how to make your own infographic. I'll also walk you through what’s an infographic and the traits of a good infographic. Let’s dive right in.
What’s an Infographic?
I’m going to address the million dollar question: what’s an infographic?

According to the Wikipedia infographic definition, an infographic is a graphic visual representation of information that’s intended to simplify the information.
Traits of A Good Infographic
Presents Information Simply
There is a fine line between too much information and just enough. So try not to over clutter your infographic with unnecessary information. (Which brings us to the next point.)
Isn't Too Long or Too Short
Limit yourself to only highlighting the most essential things trying not to make it too long or too short. With that in mind, the length of the infographic should be just fine.
Provides Clear Takeaways
Whether you are trying to highlight a particular issue or solve a problem, you should ensure that your infographic accomplishes the goal. It should have clear takeaways that the audience can learn from.
It is Focused On A Relevant Topic
What do I mean? Just any data won’t do. The infographic has to be focused on data that is going to be relevant to the audience. In the same vein, do extensive research before creating your infographic. This will help ensure that it succinctly answers any questions the audience may have on the topic.
It Creatively Visualizes Data
A while ago, you could get a lot of attention because of using infographics. But infographics have become more and more popular recently, so it's essential to ensure that you make your infographics better than your competition.
Elements of a Good Infographic
No two infographics are alike . Some address problems meticulously and others fall into oblivion. But there are a few common elements that successful infographics all poses. These include:
Unique Story
One of the things that affect the value of the infographic is having a unique story. Remember, successful infographics are the ones that appeal to the readers emotions. So supercharge your infographic by adding a unique story that stirs up the emotions of the audience.
Method
Like everything else, the method you use to create your infographics can affect its value. You can either present the infographic by using, graphs and flow charts or sequential data.
Statistical Data
The audience is not so much interested in your personal opinion but in the data. So you need to find the reference data that backs up your claims.
How To Make an Infographic
Find a Topic
One mistake that most people make when creating an infographic is beginning without a goal. So they start the infographic and get lost in the middle or create something with no sense of purpose. For you to solve a problem, you have to start with having a stellar topic.
Collect Relevant Data
Just like when writing a blog post, the first step is to collect all the data that you're going to use in the infographic. This can either be your original data or third party data. Remember, when you use third-party data, you have to cite the sources properly.
Get Your Stats Right
As I said earlier, your audience is more interested in the stats than in your personal opinion. So once you're done doing research get all your stats and numbers right. Statistics do exceptionally well because they are easy to digest. Plus they are fascinating and hold a ton of value.
Think of a Unique Story
Although you’ve got all your bases covered, it’s easy for your infographic to lack sense. Bring your infographic to life by supercharging it with a unique story that will appeal to your reader’s emotions.
Gather Your Visual Inspiration
Doing research, coming up with a story and getting your facts right is half the battle. You still have to gather visual ideas to help prepare the brain for its creative aspects.
Choose Your Desired Infographic Design Templates
Not all data is the same. So you'll need to choose infographic design templates that work for the type of data you want to present.
Download Your Template to PowerPoint
You can either create your infographic from scratch or select a template. But if you're pressed for time, you can download a premade template to PowerPoint instead.
Customize You Infographic
Here, all you have to do is plug in your data, content and infographic ideas adjusting sizes and formats to you template. You can also switch up the colors and flesh out the infographic layout so that you come up with a relevant infographic.
Include a Footer with Your Sources and Logo
Finally, you need to include links to your sources so that people know where to find the original data. This should be followed up by a logo so that people know who is behind the infographic.
And voila! You have created your very own infographic.
Conclusion
That’s it! A comprehensive blog post detailing what’s an infographic and how to make a good infographic.
In the same vein, infographic isn’t dead. It’s still as viable and useful to us as ever. But, with infographic becoming more popular, it's becoming increasingly important to stand out. So you need to supercharge your infographic with a unique story and remarkable designs.


