Data visualization can help you market your brand and win over potential customers. Charts and graphs are easy to understand and are easily shareable. When brought together, these visuals form infographics, long visuals that tell a deep story about a certain idea or concept.
You can enter the world of creative data presentation with your infographic design team. Get to know this type of content and how you can use it to grow your brand.
1. Focus on one clear goal with your design.
You may be tempted to create a long, impressive infographic with a large amount of data, but this is actually a beginner’s mistake. Instead of covering several ideas, focus on a few key data points that all focus on one goal. You can make sure your design and data align with this key goal every step of the way to ensure your target audience doesn’t get confused or distracted.

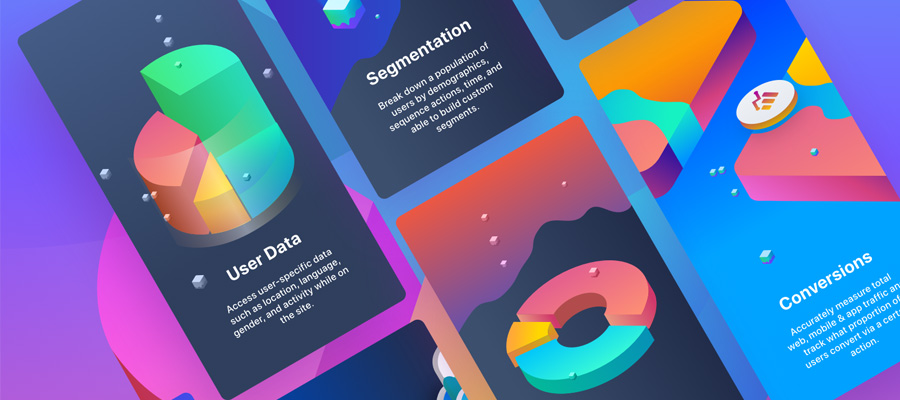
Charts templates & infographics by Alien pixels
2. Share your own data if possible.
While many teams create graphics based on data curated from multiple sources on the web, you can create something new and shareable by gathering your own data. Send out surveys to your customers or hire professionals to administer survey questions. Then present this information in a clean graphic along with a press release and social media announcement to get people excited about what you found.
3. Find an objective party to review the presentation.
If you don’t have a graphic design background or training in visual responsiveness, ask a coworker or peer to review your graphics to see if the flow makes sense and the designs look professional. You should even take this step if you hire out an infographic design service, that way you don’t have to trust that the creative team and illustrators know what they are doing.
Not only can this objective review help you catch any design issues, but it can also help you fix any small typos that your copywriting team might have missed.
4. Consider how your graphics will look on social media.
As you design your graphics, consider how people will interact with your data on Facebook, Twitter, Instagram, and even LinkedIn. Visual content performs exceedingly well on these channels, but you still need to consider what people look at – and what you want them to share.

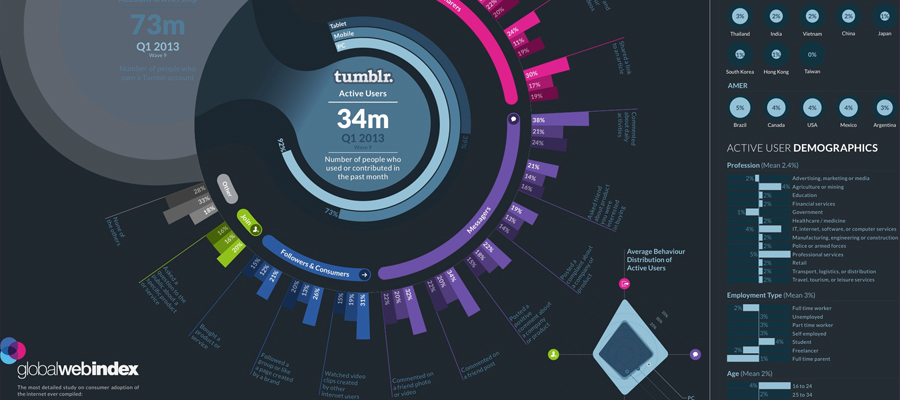
Charts templates & infographic by Alien pixels
For example, consider breaking your infographic into “digestible bites,” that can easily fit in an Instagram post or get retweets on Twitter. You can choose one or two key data points and will best connect with your target audience. If you plan to contract out your infographic design services, ask for these shareable graphics to be delivered in the final design review. You can also ask that your logo is added to each of these mini-graphic for increased brand awareness.
5. Make infographic design part of your larger content marketing strategy.
Along with developing a social media strategy for your graphics, make a plan to maximize the SEO and content marketing value of your infographics. Make sure you optimize your pages for Google Image Search and use a tool like Yoast (if you have a WordPress site) to target specific keywords related to your data. Many teams also create blog posts that introduce their graphics and break down complex data into detailed explanations. You can use this type of content to grow your SEO and attract more people to your website.
Infographic creation requires an in-depth knowledge of digital marketing. Your design team needs to know how to present data in an effective way to reach customers and make your target audience want to share. Even a great design plan can fall flat without a marketing strategy or a clearly presented brand logo to promote these beautiful visuals. Keep these essential elements in mind as you enter the wide world of data visualization.